 |
||||||||||
|
fluofit
fluofit is a set of MatLab routines for the 2d fitting of fluorescence spectra. As an input, it takes a number of emission spectra at different excitation wavelengths. It then fits the spectra with a number of asymmetric log-normal functions. Because multiple excitation wavelengths are fit at the same time, compounds with small shifts in their emission spectra that would otherwise be hard to distinguish can be separated by their shift in excitation spectra. The program was developed for fitting ESIPT dye spectra, in which two of the emission bands originate from a single species. As such, it is possible to constrain the fit so that two of the emission bands have the same excitation spectrum. Example % Read data
rawdata = csvread('fluofitexample.csv');
% 0 , 400 , 410 , 420 , 430 , 440
% ...
% 451, 18400, 21180, 23080, 18370, 12080
% 452, 20090, 22180, 23820, 19940, 12170
% 453, 20720, 23570, 25730, 20230, 12540
% 454, 22710, 24010, 26420, 21350, 12270
% 455, 22820, 25890, 28770, 23220, 13880
% ...
data = rawdata(2:end, 2:end);
em = rawdata(2:end,1);
ex = rawdata(1,2:end);
% Create options
o = fluofitopt('bands', 3, ... % 3 emission bands
'fixratio', 1, ... % 2 excitation bands
'redshift', 1, ... % second excitation band redshifted
'iterations', 100); % 100 iterations
% Fit data
[b, o] = fluofit(data, em, ex, o);
% Write fitting parameters
fluofitwrite(data, em, ex, b, 'fluofitexample', o);
% Emission
% Band rho FWHM pos
% 1 0.67 1365 561.30
% 2 0.74 3137 489.91
% 3 0.75 3450 480.77
%
% Excitation
% Band rho FWHM pos height
% 1 1.98 3965 409.50 11309.70
% 2 1.00 2564 436.29 23507.54
% 3 1.98 3965 409.50 34944.79
% Export fitted data
fluofitexport(data, em, ex, b, 'fluofitexample', o);
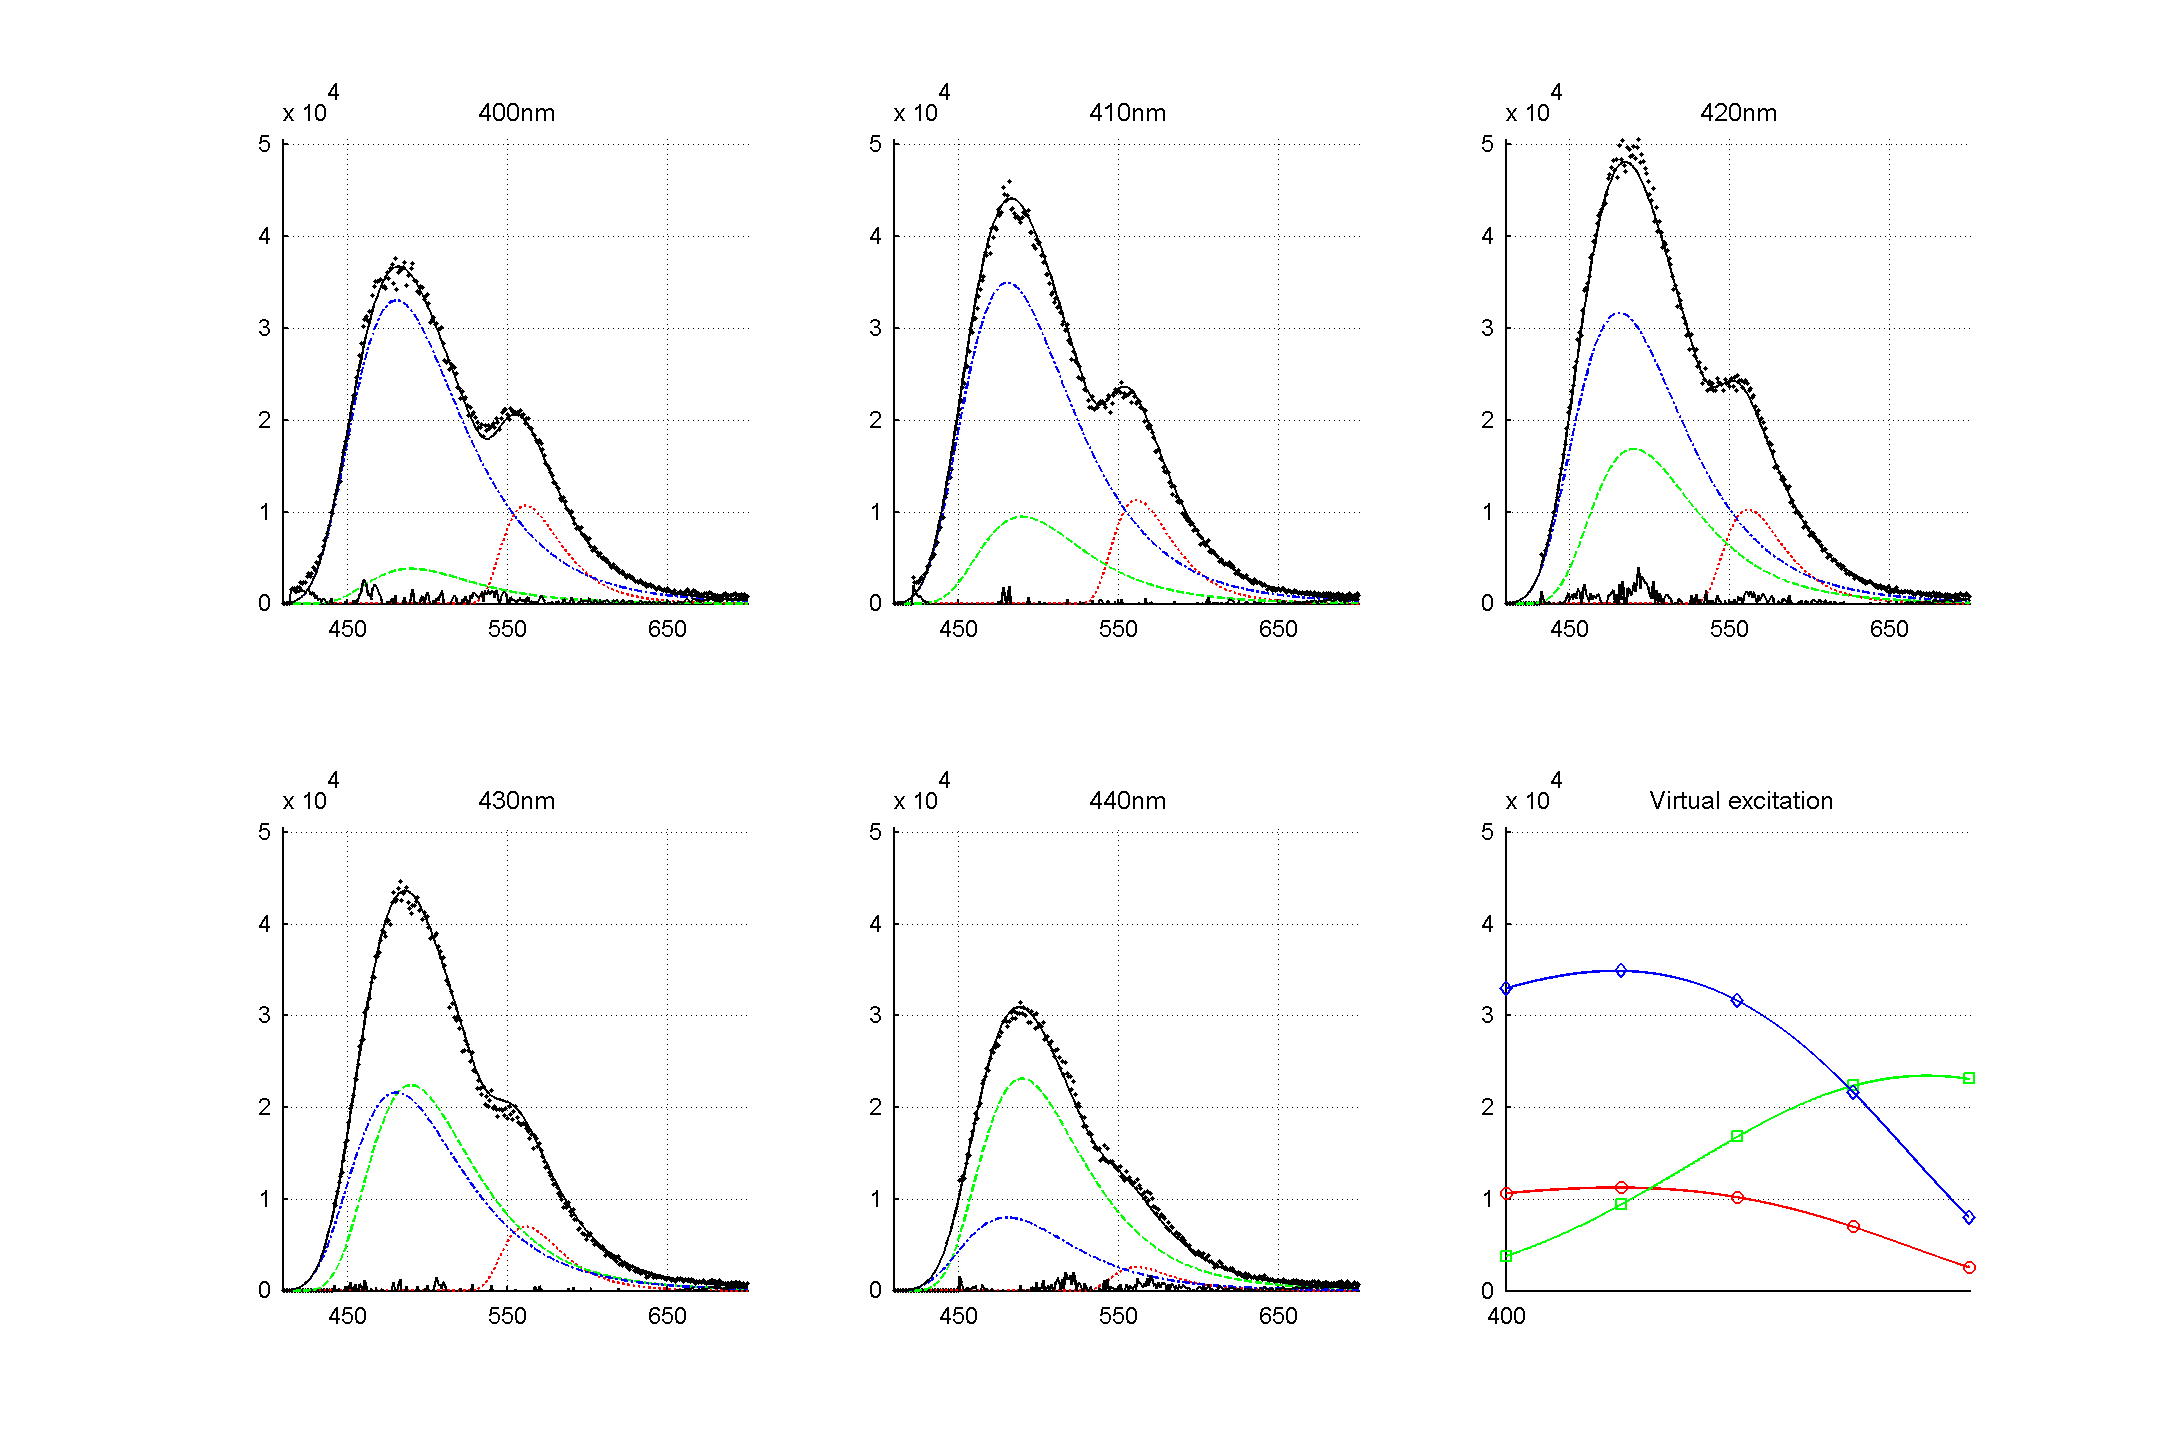 Bands 1 (red) and 3 (blue) are distinguished based on their emission spectra, while bands 2 (green) and 3 are only really separable by looking at their excitation spectra. The excitation band shapes of bands 1 and 3 are the constrained to be same, because they derive from a single ground-state species.
Downloads fluofit 0.1
References W. Caarls, M.S. Celej, A.P. Demchenko, and T.M. Jovin, Characterization of coupled ground state and excited state equilibria by fluorescence spectral deconvolution, in: Journal of Fluorescence, Vol. 20, No.1, January 2010, pp. 181-190, DOI 10.1007/s10895-009-0536-1. |
|||||||||
 |
||||||||||